- Search: Slice logs down to only what’s relevant (by service, host, status code, etc.)
- Group: Aggregate logs by dimensions like region, status, or browser.
- Visualize: Plot log groupings over time to spot spikes, regressions, or anomalies instantly.
Getting Started with Log Explorer
To get started with Log Explorer, follow the OTEL onboarding guide to set up log ingestion. Once that’s ready, you can navigate from Infra Analytics → Log Explorer from the Statsig left menu. You can also use Logs Explorer in Events Mode to search and analyze your existing Statsig Events — no additional instrumentation needed. You can switch between Logs and Events mode using the dropdown left of the search bar.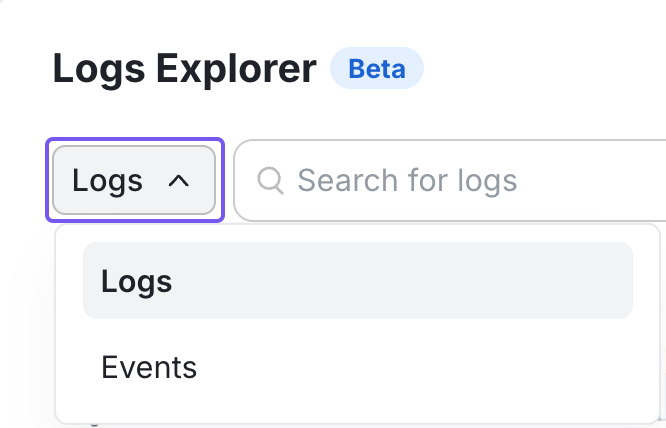
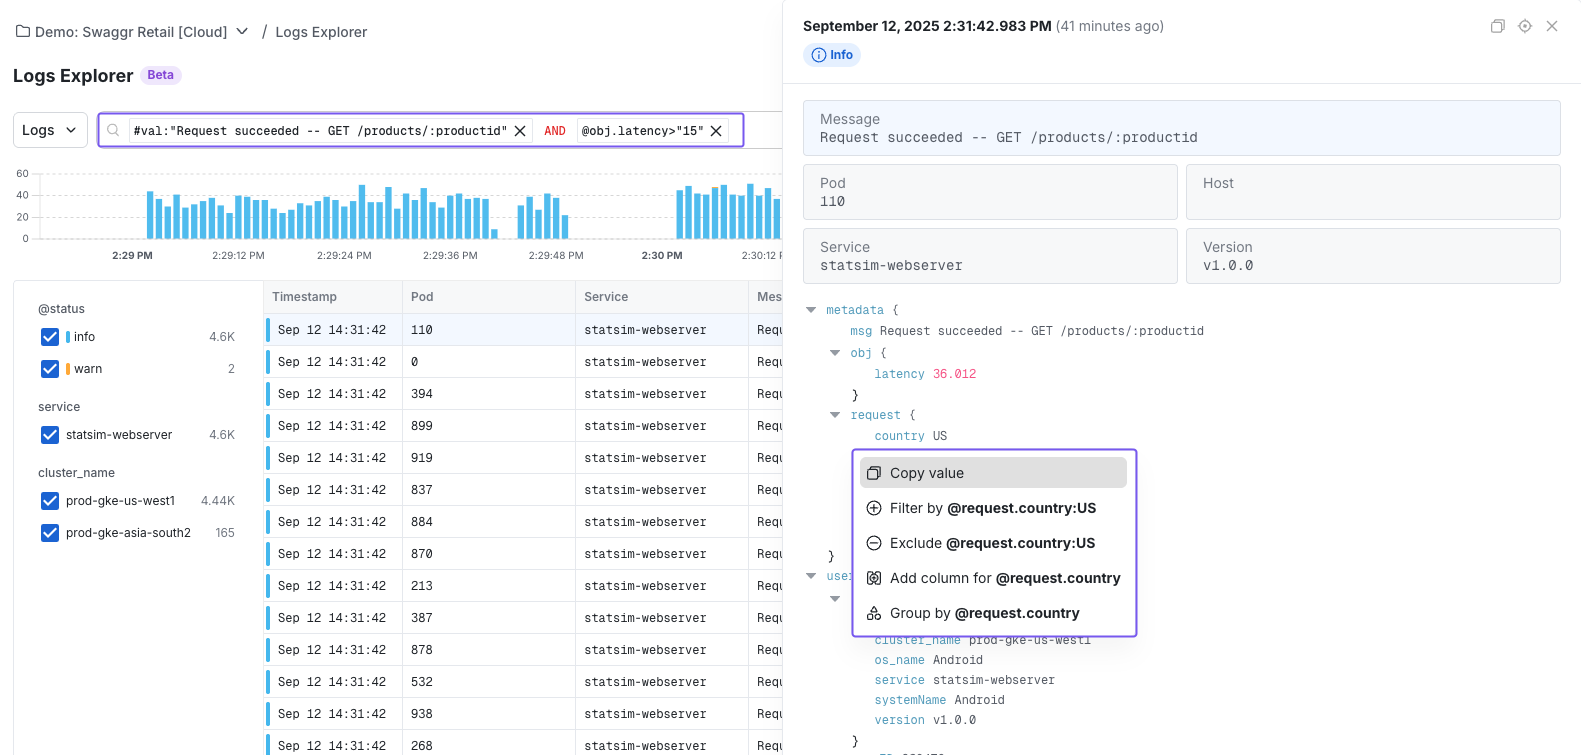
Searching in Logs Explorer
- Write custom queries: Check out our syntax guide to craft your search
- Using the query builder: Point-and-click to construct filters without syntax overhead.